- fonts
- you can set the family via the family argument within every plot command
- the specified font must be installed
- the generic (R-) fonts are always available (serif, sans, mono)
- only the text produced by this command will be affected
par(mfrow=c(2,3))
par(mar=c(6,7,5,1)+0.1) ## set plot margins appropriate
plot(c(0,1),c(0,1),bty='n',type='n',xlab="x axis",ylab="y axis",cex.lab=2)
text(.5,.5,labels="Waree",family="Waree",cex=2)
plot(c(0,1),c(0,1),bty='n',type='n',xlab="x axis",ylab="y axis",cex.lab=2)
text(.5,.5,labels="Nimbus Mono",family="Nimbus Mono",cex=2)
plot(c(0,1),c(0,1),bty='n',type='n',xlab="x axis",ylab="y axis",cex.lab=2)
text(.5,.5,labels="Century Schoolbook L",family="Century Schoolbook L",cex=2)
plot(c(0,1),c(0,1),bty='n',type='n',xlab="x axis",ylab="y axis",cex.lab=2)
text(.5,.5,labels="Liberation Serif",family="Liberation Serif",cex=2)
plot(c(0,1),c(0,1),bty='n',type='n',xlab="x axis",ylab="y axis",cex.lab=2)
text(.5,.5,labels="URW Gothic L",family="URW Gothic L",cex=2)
plot(c(0,1),c(0,1),bty='n',type='n',xlab="x axis",ylab="y axis",cex.lab=2)
text(.5,.5,labels="URW Palladio L",family="URW Palladio L",cex=2)

- it is better to set family via par, so all following produced text is uniform
par(mfrow=c(2,2))
par(mar=c(6,7,5,1)+0.1) ## set plot margins appropriate
par(family="Waree") ## set family
plot(c(0,1),c(0,1),bty='n',type='n',xlab="x axis",ylab="y axis",cex.lab=2)
text(.5,.5,labels="Waree",cex=2)
par(family="URW Palladio L") ## set family
plot(c(0,1),c(0,1),bty='n',type='n',xlab="x axis",ylab="y axis",cex.lab=2)
text(.5,.5,labels="URW Palladio L",cex=2)
par(family="Tlwg Typo") ## set family
plot(c(0,1),c(0,1),bty='n',type='n',xlab="x axis",ylab="y axis",cex.lab=2)
text(.5,.5,labels="Tlwg Typo",cex=2)
par(family="Ubuntu Mono") ## set family
plot(c(0,1),c(0,1),bty='n',type='n',xlab="x axis",ylab="y axis",cex.lab=2)
text(.5,.5,labels="Ubuntu Mono",cex=2)

- you can set the family via the family argument within every plot command
Tuesday, December 18, 2012
R graphics - customizing text - font


R graphics - customizing text - text size
- text size
- there are ps and cex
- ps defines an absolute text size
- cex specifies a multiplicative modifier
- final font size = fontsize * cex
- cex is used e.g. in cex.axis (text drawn as tick labels), cex.lab (axis labels), cex.main (title), cex.sub (subtitle)
- cex affects in most cases the plot symbols
par(mfrow=c(2,3))
par(mar=c(6,7,5,1)+0.1) ## set plot margins appropriate
plot(1:10,1:10,bty='n',xlab="x axis",ylab="y axis",sub="subtitle",main="title")
plot(1:10,1:10,bty='n',xlab="x axis",ylab="y axis",sub="subtitle",main="title (mult: 2)",cex.main=2,cex=2)
plot(1:10,1:10,bty='n',xlab="x axis  (mult: 2)",ylab="y axis (mult: 2)",sub="subtitle",main="title",cex.lab=2,cex=3)
plot(1:10,1:10,bty='n',xlab="x axis",ylab="y axis",sub="subtitle (mult: 2)",main="title (mult: 2)",cex.main=2,cex.sub=2,cex=0.5)
plot(1:10,1:10,bty='n',xlab="x axis",ylab="y axis",sub="subtitle (mult: 2)",main="title (mult: 0.5)",cex.main=0.5,cex.sub=2,cex=seq(1,5))
plot(1:10,1:10,bty='n',xlab="x axis  (mult: 3)",ylab="y axis (mult: 3)",sub="subtitle",main="title (mult: 4)", cex.lab=3,cex.main=4,cex=sample(4,10,replace=T))

- ps is set through par()
- the default value is 12
- in the following graph ps is subsequently set to default, 9, 15, 5
par(mfrow=c(2,2))
plot(1:10,1:10,bty='n',xlab="x axis",ylab="y axis",sub="subtitle",main="title")
par(ps=9)
plot(1:10,1:10,bty='n',xlab="x axis",ylab="y axis",sub="subtitle",main="title")
par(ps=15)
plot(1:10,1:10,bty='n',xlab="x axis",ylab="y axis",sub="subtitle",main="title")
par(ps=5)
plot(1:10,1:10,bty='n',xlab="x axis",ylab="y axis",sub="subtitle",main="title")

- there are ps and cex


R graphics - par() - lty
line types
- again we use the tree data set as example data set
head(trees)
Girth Height Volume
1   8.3     70   10.3
2   8.6     65   10.3
3   8.8     63   10.2
4  10.5     72   16.4
5  10.7     81   18.8
6  10.8     83   19.7
- there are few arguments which control the appearance of lines
- lty line type
- lwd line width and of course
- col color
- lty line type
- first we have a look at lty, one can change the style of the line specifying the type either as a string or the corresponding integer, the default appearance is a solid (or 1), black line:
plot(trees$Girth,trees$Height,type="l",main="lty default ('solid')") ## a default line

- dashed line
plot(trees$Girth,trees$Height,type="l",lty=2,main="lty='dashed' (2)") ## a dashed line

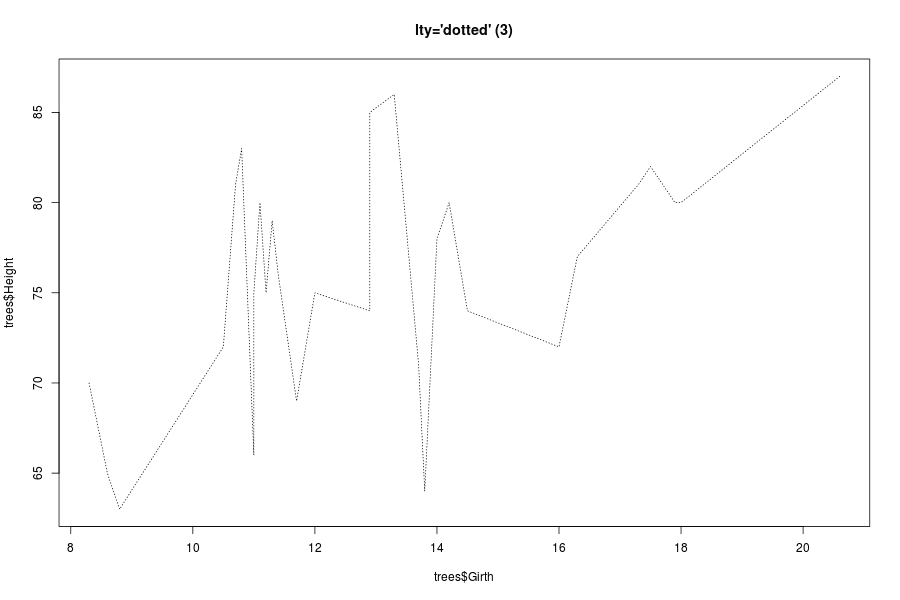
- dotted line
plot(trees$Girth,trees$Height,type="l",lty=3,main="lty='dotted' (3)") ## a dotted line
dot-dash-line
plot(trees$Girth,trees$Height,type="l",lty=4,main="lty='dotdash' (4)") ## a dotdash line

- long dashes
plot(trees$Girth,trees$Height,type="l",lty=5,main="lty='longdash' (5)") ## a long dash line

- two dashes
plot(trees$Girth,trees$Height,type="l",lty=6,main="lty='twodash' (6)") ## a two-dash line

- custom line types
- you can also define a custom line type by specifying a string of length 2, 4, 6, or 8 which consists of non-zero hexadecimal digits
- each digit gives the length of a segment, alternatively drawn and skipped
- the unit of these segments are proportional to the line width (defined by lwd)
- here are some examples:
- a long line (15 units) followed by short off (4 units) followed by 3 units on, off, on, off; once with default line width and once with lwd=4
- a long line (15 units) followed by short off (4 units) followed by 3 units on, off, on, off; once with default line width and once with lwd=4
par(mfrow=c(1,2))
plot(1:10,sample(10),type="l",lty="F43333", main="lty='F43333', lwd=1")
plot(1:10,sample(10),type="l",lwd=4, lty="F43333", main="lty='F43333', lwd=4")

- a line (10 units) followed by 10 units off followed by 5 units on, 2 units off, 5 units on, 2 units off; once with default line width and once with lwd=2
par(mfrow=c(1,2))
plot(1:10,sample(10),type="l",lty="AA5252", main="lty='AA5252', lwd=1")
plot(1:10,sample(10),type="l",lwd=4, lty="AA5252", main="lty='AA5252', lwd=2")

- you can also define a custom line type by specifying a string of length 2, 4, 6, or 8 which consists of non-zero hexadecimal digits


R graphics plot types
scatter plot types
- we use the tree data set as example data set
head(trees)
Girth Height Volume
1   8.3     70   10.3
2   8.6     65   10.3
3   8.8     63   10.2
4  10.5     72   16.4
5  10.7     81   18.8
6  10.8     83   19.7
par(mfrow=c(3,3))
plot(trees$Girth,trees$Height,type="p",main="type='p'") ## points
plot(trees$Girth,trees$Height,type="l",main="type='l'") ## a line
plot(trees$Girth,trees$Height,type="b",main="type='b'") ## both
plot(trees$Girth,trees$Height,type="o",main="type='o'") ## both overplotted
plot(trees$Girth,trees$Height,type="c",main="type='c'") ## lines like in "b"
plot(trees$Girth,trees$Height,type="h",main="type='h'") ## vertical lines
plot(trees$Girth,trees$Height,type="s",main="type='s'") ## stair steps (first horizontal)
plot(trees$Girth,trees$Height,type="S",main="type='S'") ## stair steps (first vertical)
plot(trees$Girth,trees$Height,type="n",main="type='n'") ## none

Subscribe to:
Posts
(
Atom
)